ADR Mediation Tool features
FORECAST
First step:
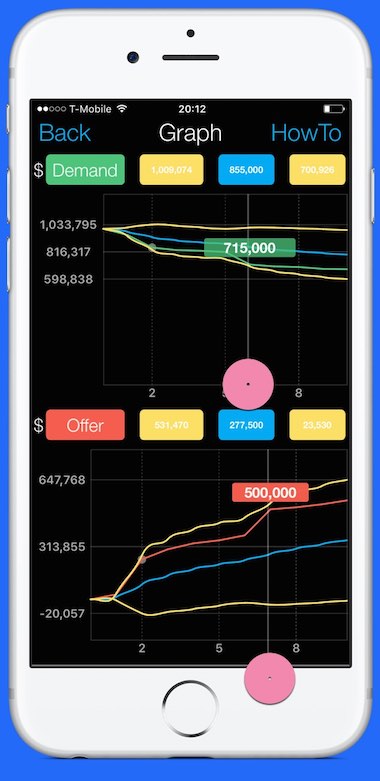
Apply Bollinger Bands to identify the beginning of a serial progression. Exclude from the curve the bracket values delimited by a white circle, then select part of the curve that stays in between the yellow bands.
Second step:
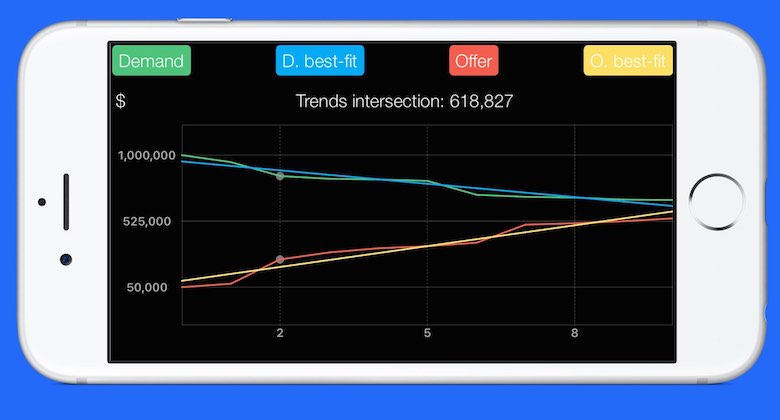
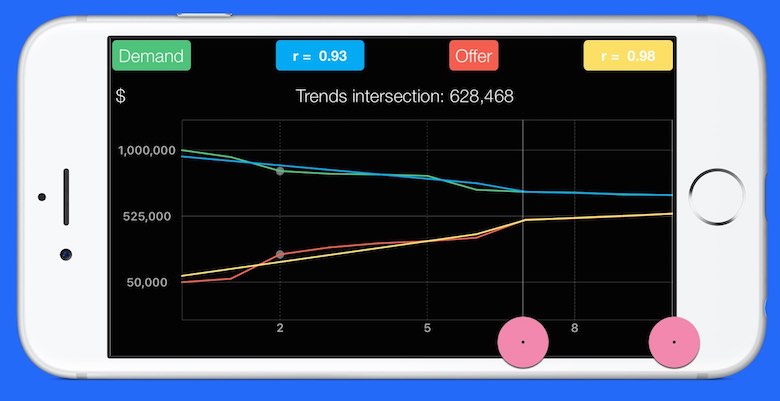
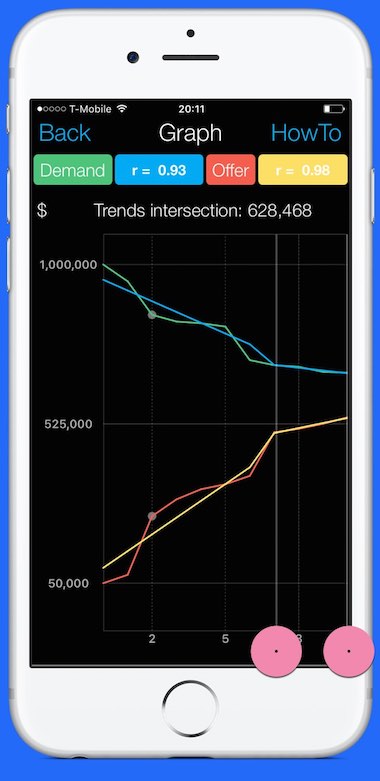
Tap with two fingers to apply linear regression on the selected curve portions. Correlation coefficient close to 1 indicates how well data fit the statistical model. The computed “trends intersections” value is the forecast settlement amount.
Rationale:
ADR MediationTool puts Finance Analytics at the service of the lawyer.
Once established the BATNA all the numbers expressed during the demands and offer dance of the ADR mediation falls within the initial offer and the reservation point range. These numbers, generated by guessing games, dictated by emotional responses or formulated following specific tactics, compose trends. Forecasting the settlement amount requires an insight of these trends and the prediction of their intersection point. Finance analytics tools are the solution. Demands and offers are treated as stock prices.
Bollinger Bands, which is a volatility indicator, shows the trend (price) fluctuations. High volatility is followed by a low volatility and vice versa. It indicates when the trend is reliable, as in the case of “offers serial progression”. Trend values should stay within the bands with a probability of the 95%.
Bands are narrow when the market is calm. Bands are wide when there is an impulse and thrusting move. When the prize goes out of the bands for math laws bounces back to the middle of the bands.
Since bouncing is repetitive, when the bands are narrow it could be foreseen a close potential breakout. Bollinger Bands provide a pattern recognition mean for recurring events as sudden trend change. It is used to identify the start of a serial progression.
Linear Regression, which is a momentum indicator, shows trend strength and direction. Tapping with two fingers on the linear regression chart allows computing the linear regression on only the selected portion of the demand and offering curves. If the selected curve portion match the trends range considered reliable, then the resulting linear regression curves intersection provides the settlement meeting point.